How PWM Excitation Affects Motor Performance
When designing an electric motor, it is common to do a time-stepping simulation using ideal sinusoidal currents. This is a useful approximation, particularly during the initial design stage.
However, a real motor is often driven by an inverter using pulse-width modulation (PWM), and the resulting current is not perfectly sinusoidal. This difference becomes particularly important for low-inductance / high-speed motors, where the motor current can contain significant switching-frequency ripple.
In this article, we compare a motor simulated with ideal sinusoidal excitation against the same motor using PWM-derived current waveforms at different switching frequencies. The aim is to see how much difference the actual excitation waveform makes to the simulated motor performance.
Why does PWM cause current ripple?
A simplified motor phase can be represented by:
The motor inductance opposes rapid changes in current. A motor with high inductance will naturally smooth the voltage switching, while a low-inductance motor allows the current to change more quickly. The electrical time constant is approximately:
When the PWM switching period is not sufficiently small compared with this time constant, the current can contain significant ripple. For example, instead of an ideal current such as:
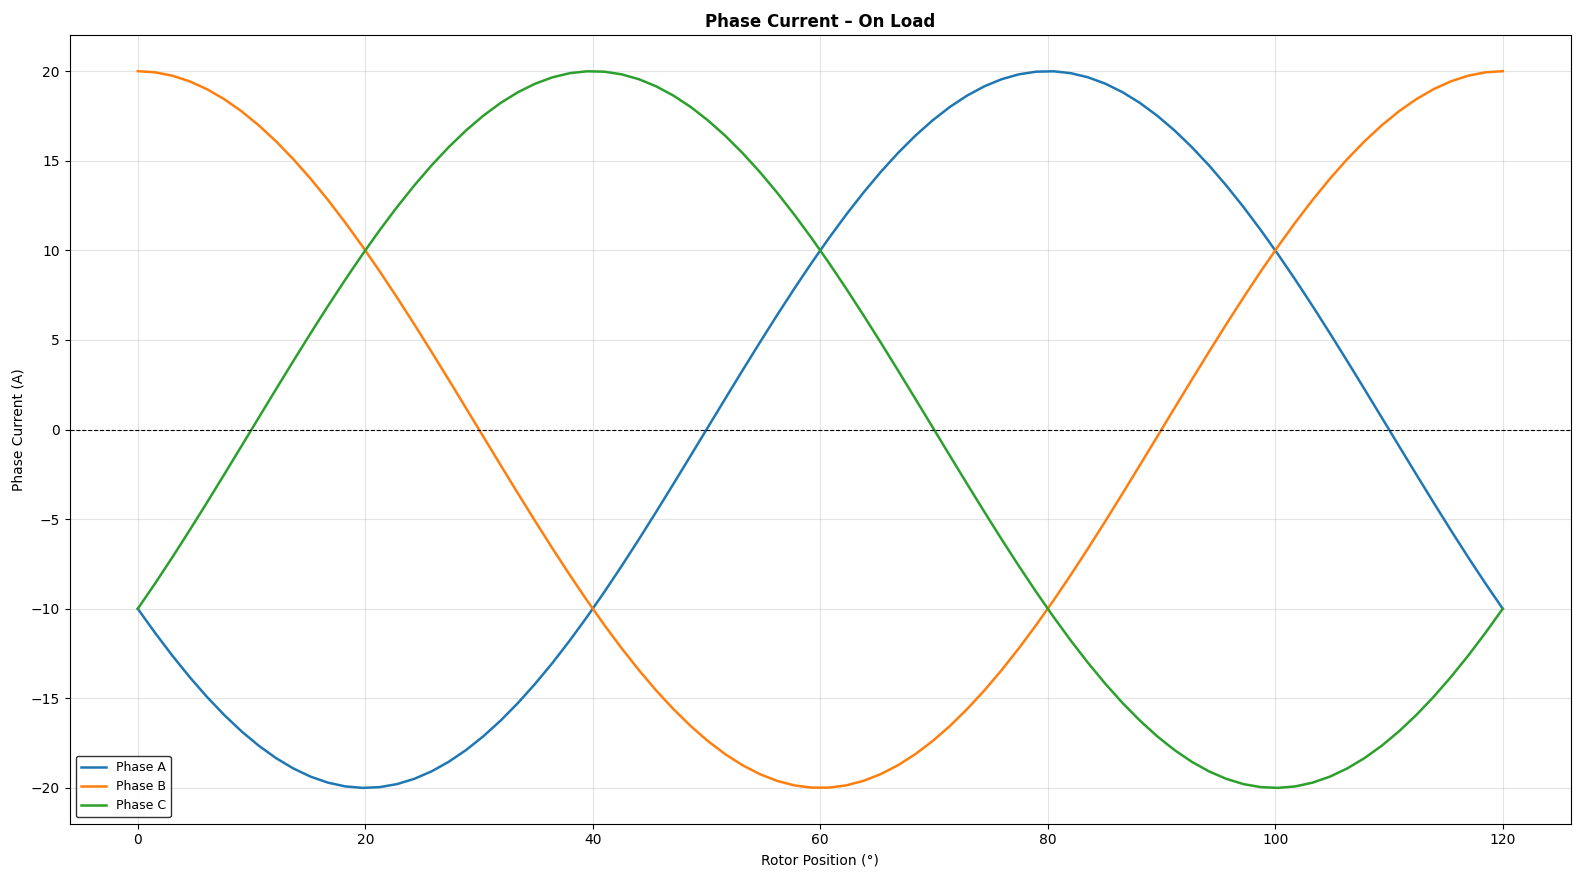
the actual current may look more like:
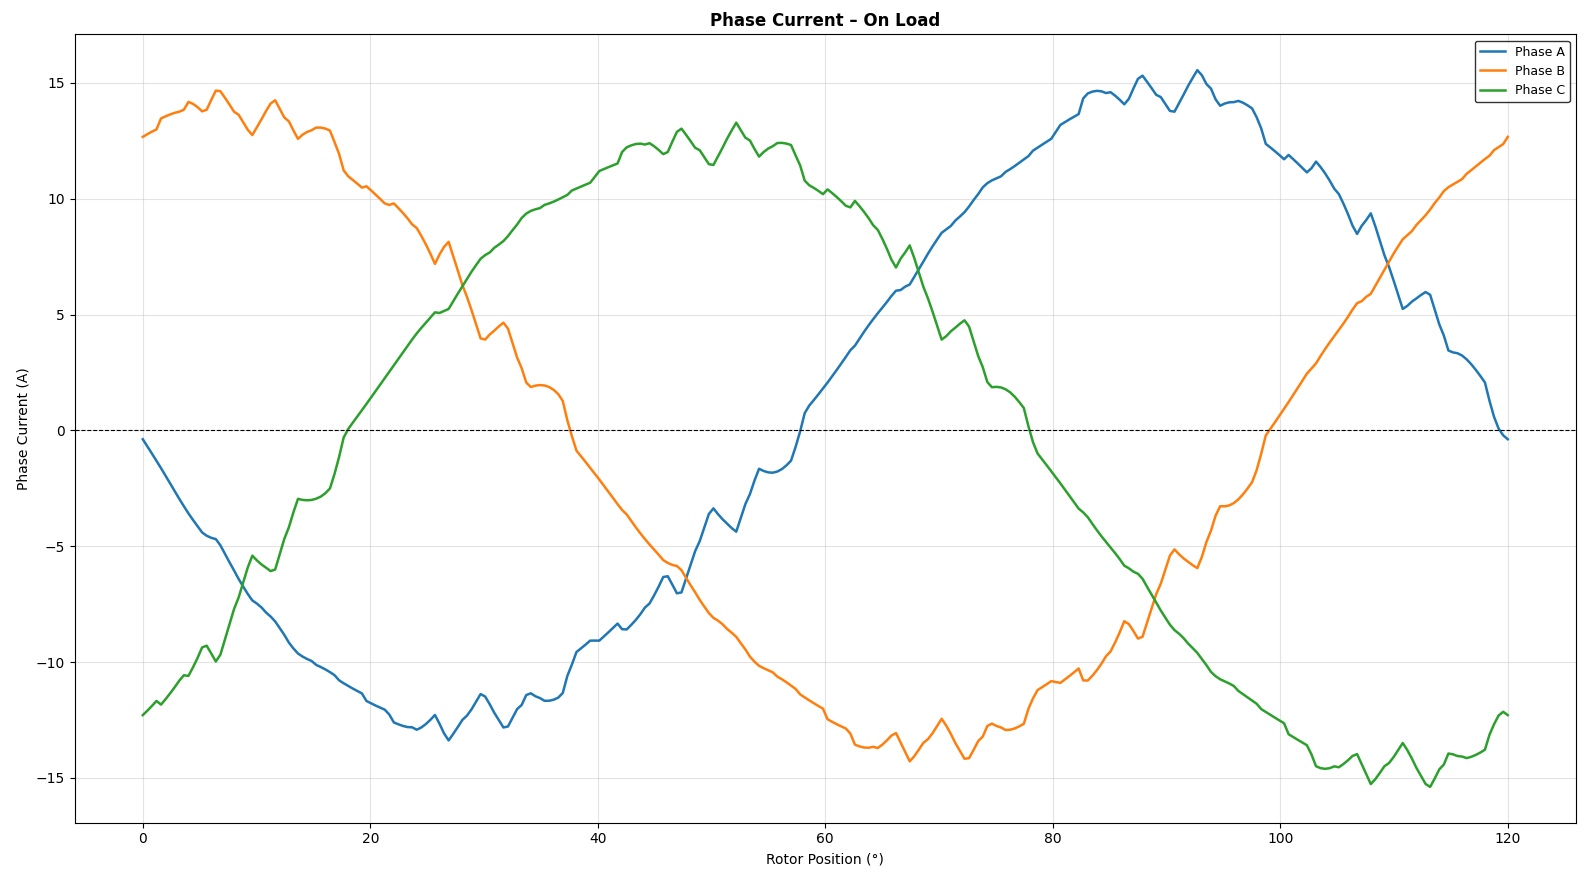
The average current can still follow the desired sinusoidal reference, but additional high-frequency components are present. These components can affect motor losses and torque ripple.
Generating the PWM excitation
To investigate this, we first need a realistic current waveform. The MotorDesignSoftware PWM waveform calculator computes the current response from parameters such as phase resistance, phase inductance, switching frequency, electrical frequency, DC-bus voltage, and the back-EMF value or waveform.
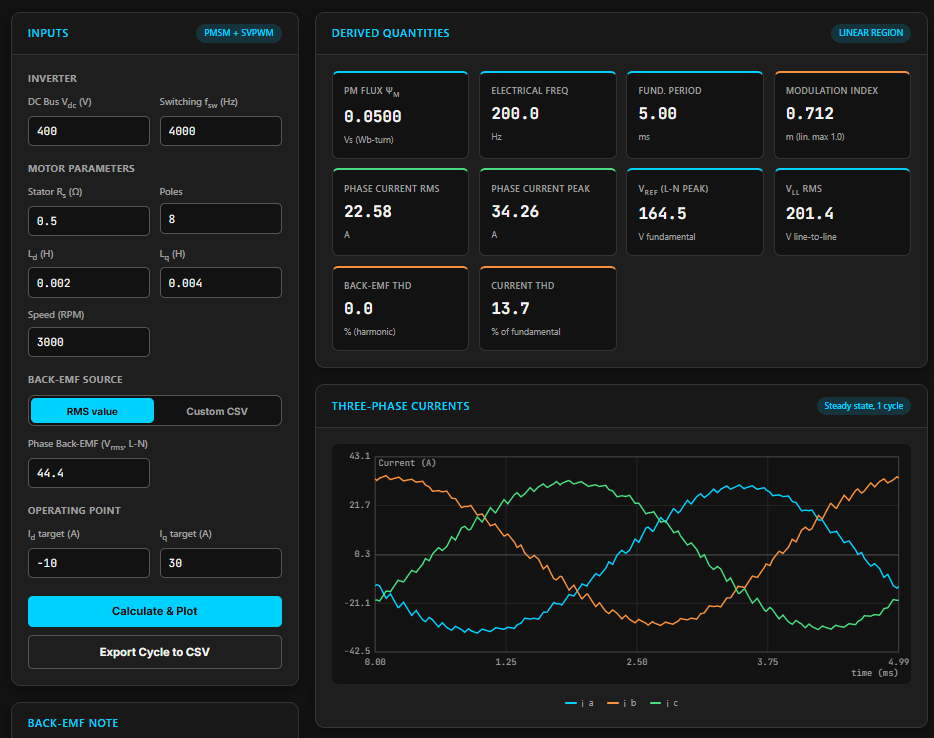
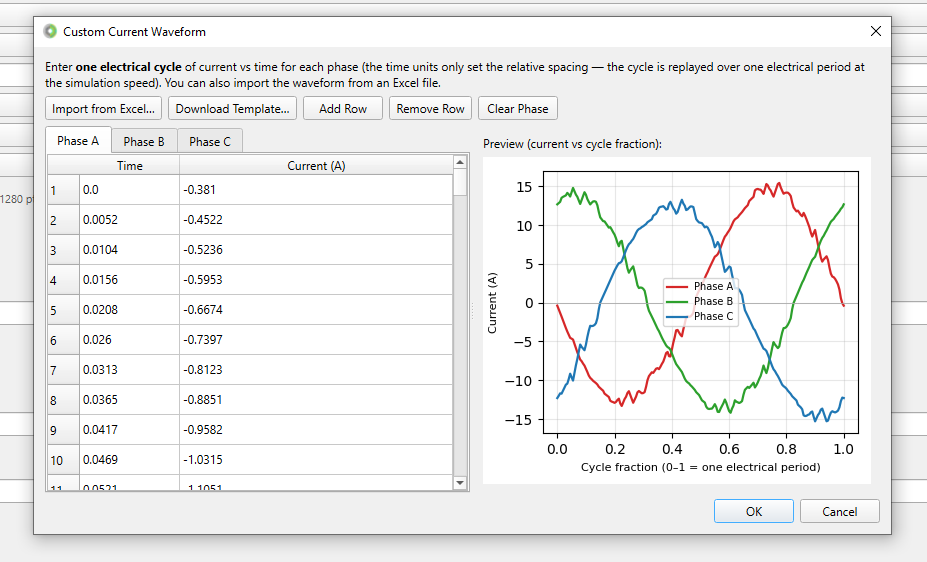
The resulting current waveform can be exported as a spreadsheet and then imported into the motor simulation as a custom excitation waveform. This lets the same motor model be simulated under different excitation conditions without changing the motor geometry.
Simulation setup
For this study, a generic 36-slot, 6-pole, medium-inductance motor with the following parameters was considered:
| Parameter | Value |
|---|---|
| Rated power | 3 kW |
| Rated speed | 1500 rpm |
| Phase resistance | 0.5 Ω |
| d-axis inductance (NL) | 8.67 mH |
| q-axis inductance (NL) | 27.92 mH |
| Current | 10 A |
| Electrical frequency | 75 Hz |
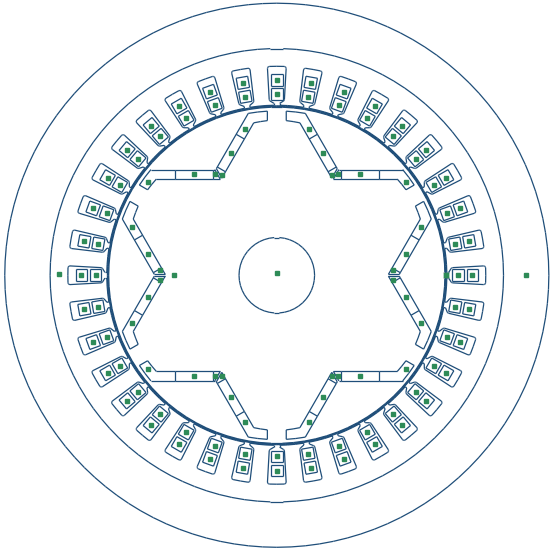
To keep the comparison fair, all simulation parameters except the current waveform were kept the same, and the following four cases were simulated and compared:
- Ideal sinusoidal excitation
- PWM excitation at 4 kHz
- PWM excitation at 16 kHz
- PWM excitation at 100 kHz
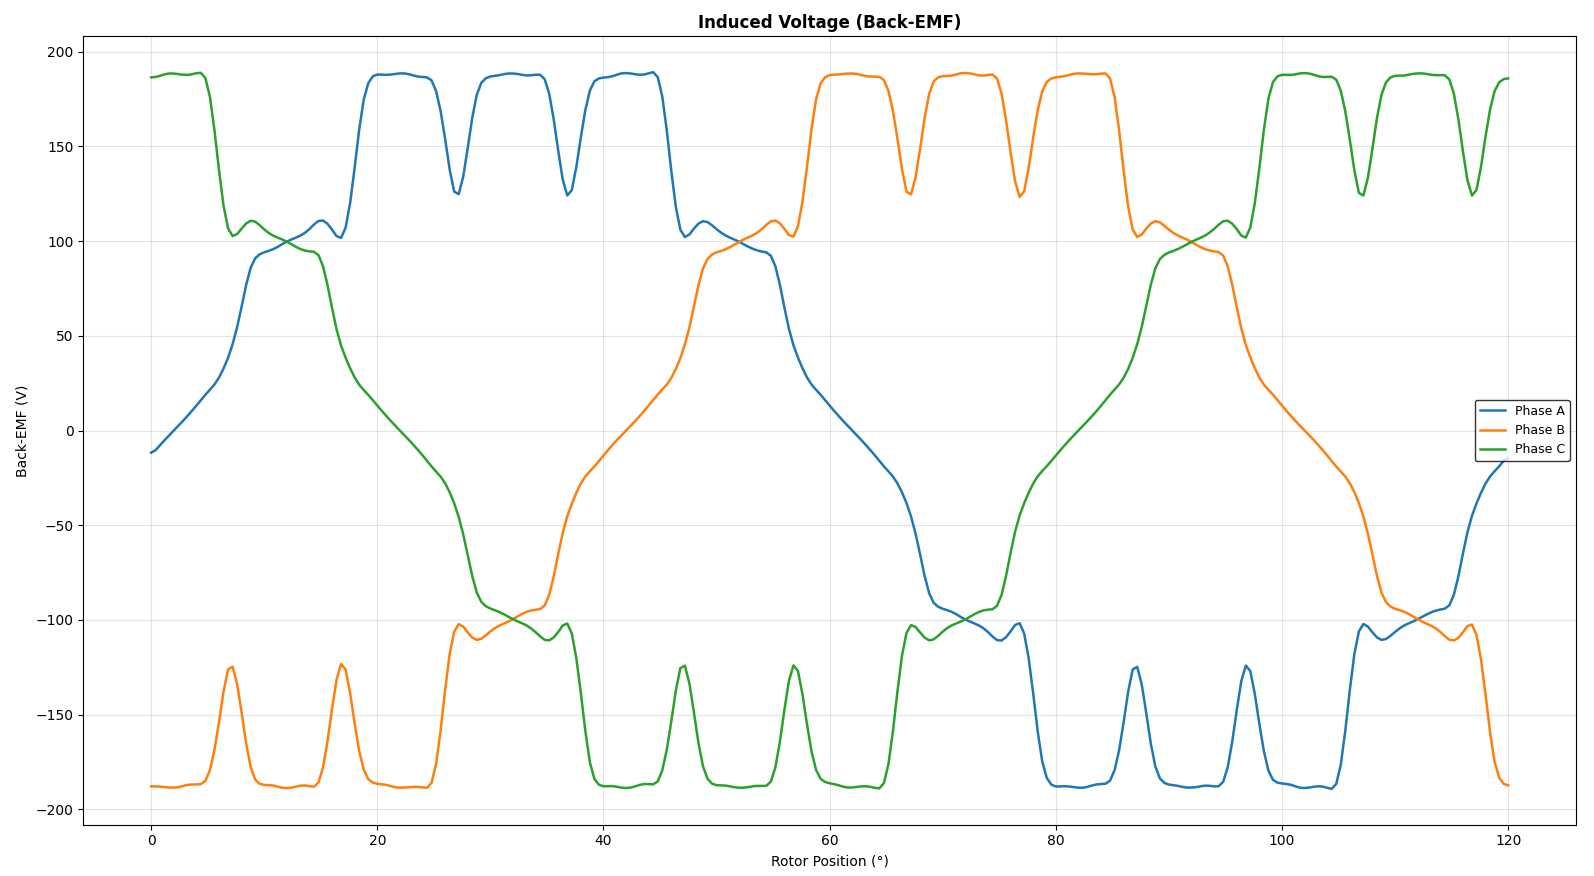
To get the current waveform at each switching frequency, the back-EMF waveform was extracted from the simulation and entered into the PWM waveform calculator to produce the corresponding PWM current waveforms.
Simulation
Back-EMF simulation
The current waveform depends on the back-EMF of the motor, so to get an accurate current waveform a back-EMF simulation was done first, using a 600-step simulation for higher waveform accuracy. The back-EMF graphs, resistance, Ld, Lq, speed and pole count were then exported and entered into the calculator.
Simulation with current excitation
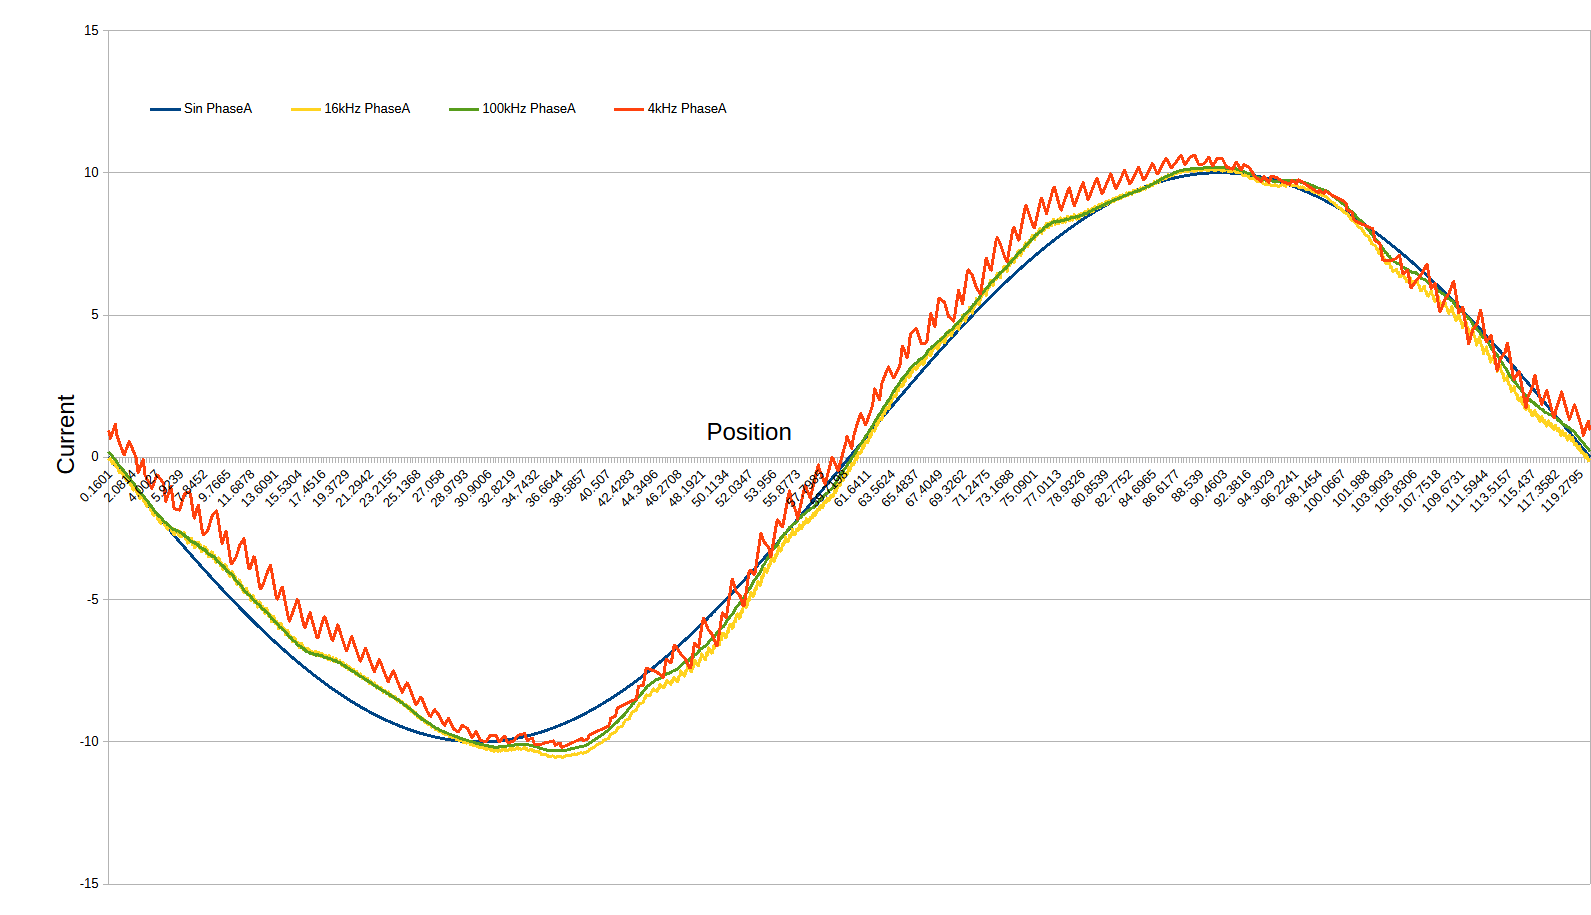
Four simulations were run — one with sinusoidal current and three with PWM current at different switching frequencies. The difference in current waveform is quite evident:
For good accuracy, the number of steps per electrical cycle was set to 1500, and the air-gap mesh density was adjusted to give at least five mesh layers across the air gap.
Results
The simulation results are summarized below.
| Excitation type | Torque ripple | Cu loss | Core loss | Magnet loss | Efficiency |
|---|---|---|---|---|---|
| Sinusoidal | 42.7 % | 87.9 W | 45.55 W | 0.09 W | 95.55 % |
| 4 kHz PWM | 84.3 % | 93.7 W | 58.2 W | 0.135 W | 93.1 % |
| 16 kHz PWM | 67.13 % | 91.5 W | 58.43 W | 0.135 W | 93.2 % |
| 100 kHz PWM | 61.36 % | 90.6 W | 58.45 W | 0.132 W | 93.25 % |
The comparison of torque ripple and copper loss across all excitation types is shown below.
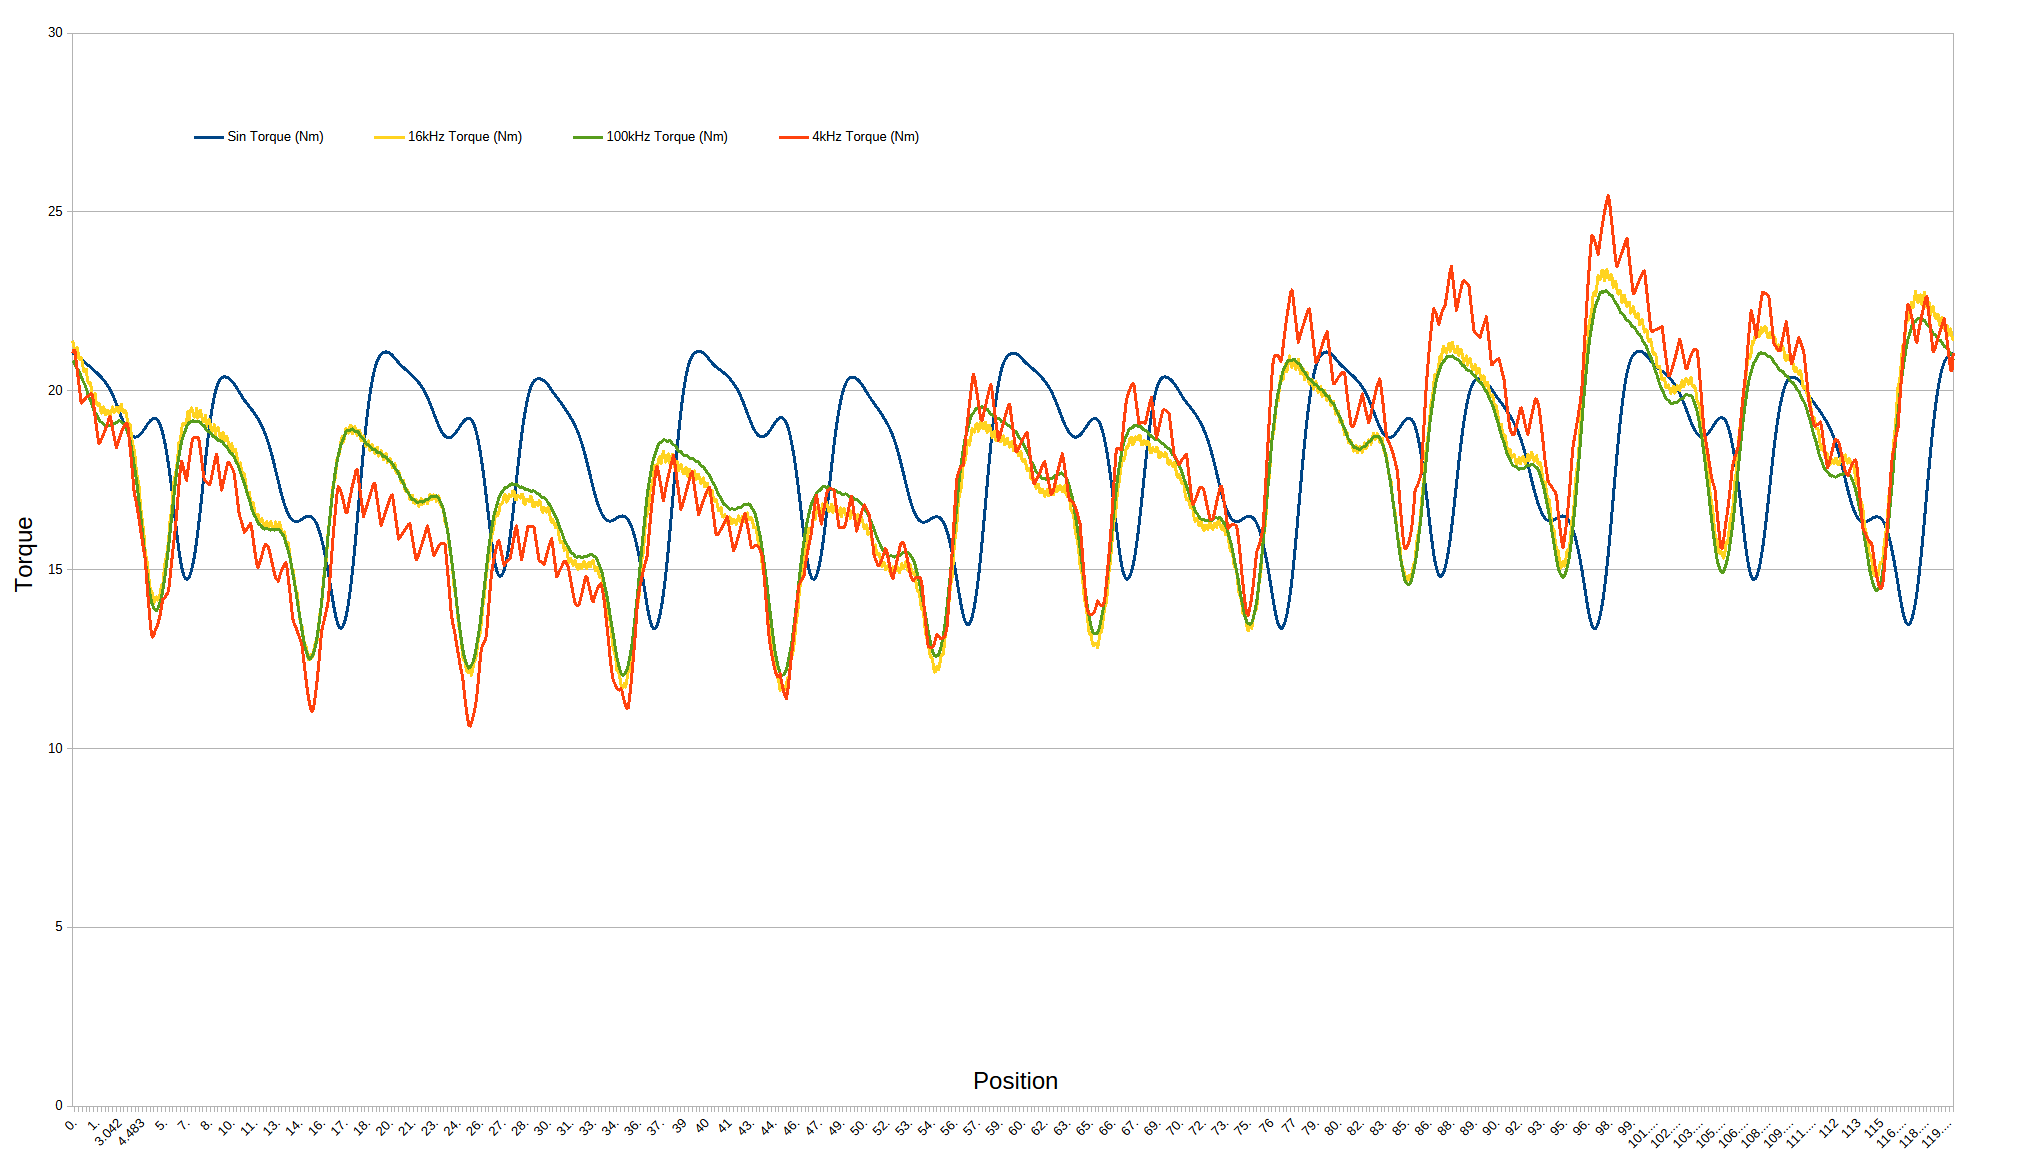
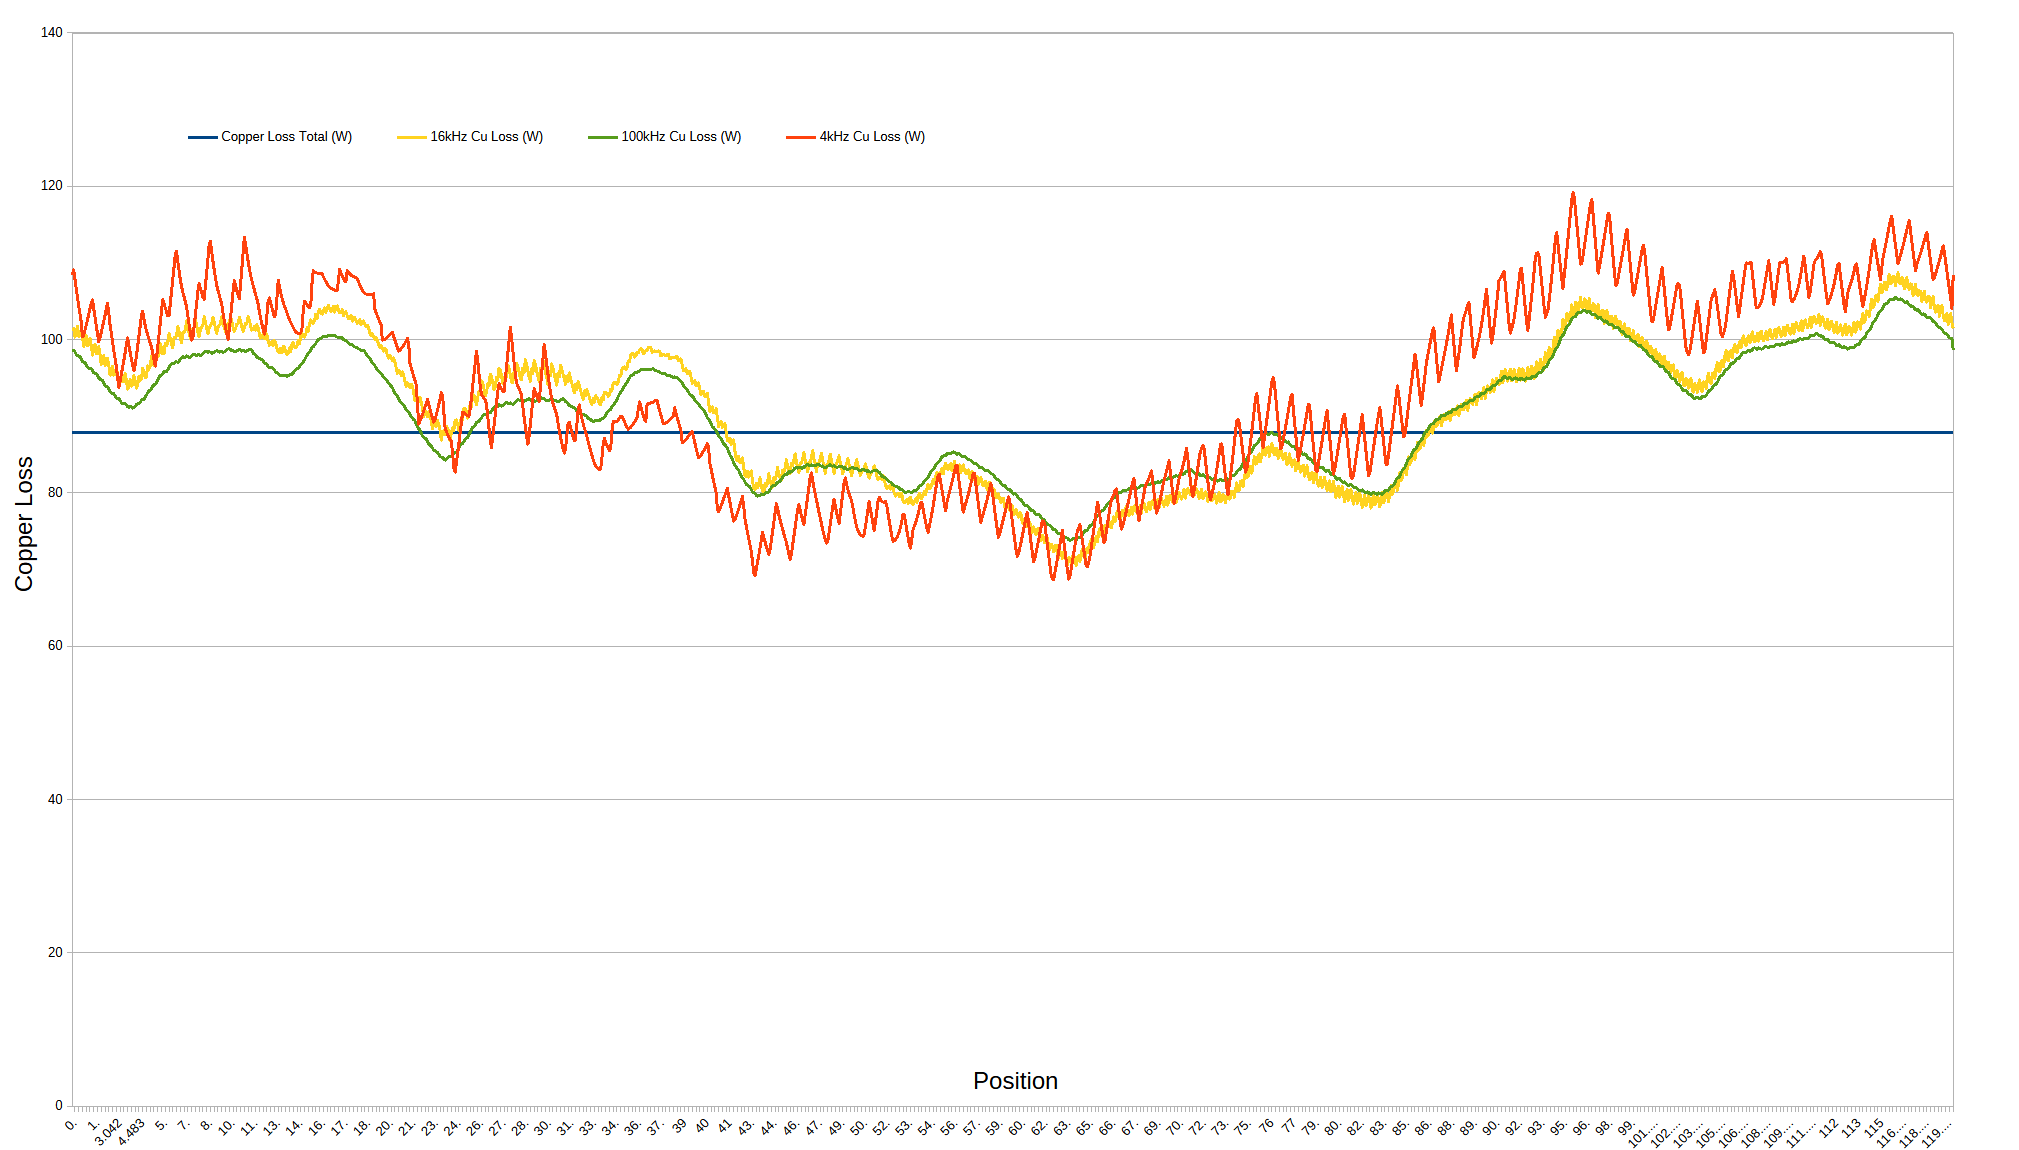
Analyzing why the graphs look the way they do would need an article of its own, so here is a short comparison:
- Torque ripple: as expected, increasing the switching frequency reduced torque ripple, because the current ripple was smaller.
- Copper loss: similar to torque ripple, the higher current ripple at lower switching frequencies raised copper loss. However, with thicker wire the skin effect would become more prevalent and we would observe the opposite trend. (A future article will cover skin effect and its impact on motors.)
- Core loss: the effect on core loss is more interesting. The additional high-frequency components in the current produce corresponding high-frequency components in the magnetic field, so core loss increases with switching frequency.
- Magnet eddy loss: ideally magnet eddy current would also increase with switching frequency, but since this is an IPM motor the magnets are not exposed to air-gap harmonics, so the losses stay roughly the same.
How important is PWM excitation?
The answer depends on the motor. For a relatively high-inductance motor operating at a high switching frequency, the actual current may be close enough to sinusoidal that the difference is small. For a low-inductance motor, the difference can be much more significant. This suggests a useful two-stage approach during motor development:
- Early design: use sinusoidal excitation to quickly investigate the electromagnetic design.
- Detailed analysis: use the expected PWM current waveform to investigate the additional losses and torque ripple.
Conclusion
Ideal sinusoidal excitation remains a very useful approximation for motor design, but it does not always represent the current the motor will actually experience. For low-inductance motors in particular, PWM switching can produce significant current ripple.
By importing a realistic excitation waveform into an electromagnetic simulation, we can check whether this ripple has a meaningful effect on torque, losses and efficiency. The comparison in this example shows that the switching frequency can have a measurable effect on motor performance. So once the basic design is established, including the actual inverter excitation gives a more realistic picture of the final motor performance.
About the simulation
The simulations in this article were performed using MotorDesignSoftware and FEMM. MotorDesignSoftware supports custom excitation waveforms, so motors can be analyzed using realistic current waveforms rather than only ideal sinusoidal excitation. The accompanying PWM waveform calculator generates current excitation data for different motor and switching conditions. Try it yourself:
- FEMM: femm.info/download
- MotorDesignSoftware: get a license
- PWM calculator: PWM waveform calculator
← Back to all articles